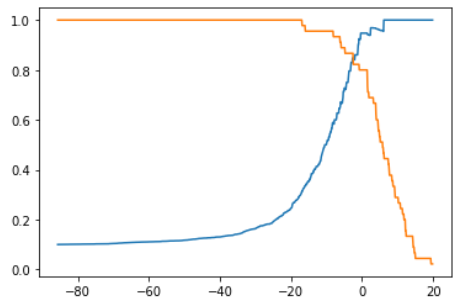
10-6 precision-recall曲线
import numpy as np
from sklearn import datasets

digits = datasets.load_digits()
X = digits.data
y = digits.target.copy()

y[digits.target==9] = 1
y[digits.target!=9] = 0

from sklearn.model_selection import train_test_split
X_train, X_test, y_train, y_test = train_test_split(X, y, random_state=666)

from sklearn.linear_model import LogisticRegression

log_reg = LogisticRegression()
log_reg.fit(X_train, y_train)
log_reg.score(X_test, y_test)精准率和召回率的变化曲线
绘制precision-recall曲线

scikit-learn中的precision-recall曲线

关于precision-recall曲线的理论说明
Last updated


