import numpy as np
import matplotlib.pyplot as plt
x = np.random.uniform(-3, 3, size=100)
X = x. reshape(-1, 1)
y = 0.5 * x**2 + x + 2 + np.random.normal(0, 1, size=100)
from sklearn.linear_model import LinearRegression
lin_reg = LinearRegression()
lin_reg.fit(X, y)
lin_reg.score(X, y) # score = 0.4953707811865009
y_predict = lin_reg.predict(X)
plt.scatter(x, y)
plt.plot(np.sort(x), y_predict[np.argsort(x)], color='r')
plt.show()
from sklearn.metrics import mean_squared_error
y_predict = lin_reg.predict(X)
mean_squared_error(y, y_predict)
from sklearn.pipeline import Pipeline
from sklearn.preprocessing import PolynomialFeatures
from sklearn.preprocessing import StandardScaler
from sklearn.linear_model import LinearRegression
def PolynomialRegression(degree):
return Pipeline([
("poly", PolynomialFeatures(degree=degree)),
("std_scaler", StandardScaler()),
("lin_reg", LinearRegression())
])
poly2_reg = PolynomialRegression(degree=2)
poly2_reg.fit(X, y)
y2_predict = poly2_reg.predict(X)
mean_squared_error(y, y2_predict) # 1.0987392142417856
y_predict = lin_reg.predict(X)
plt.scatter(x, y)
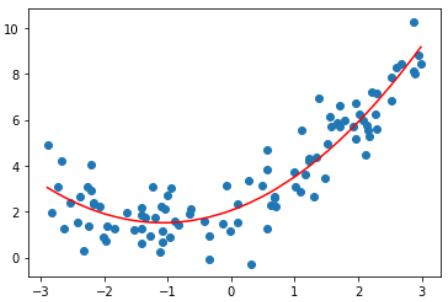
plt.plot(np.sort(x), y2_predict[np.argsort(x)], color='r')
plt.show()
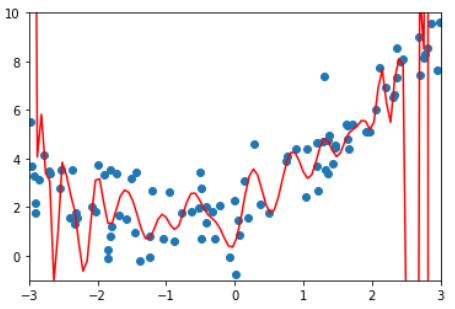
结论:degree越高,对训练样本的拟合越好。
因为当degree足够大,总能找到一根曲线拟合所有的样本点,使得均方误差为0.
虽然拟合结果的均方误差小了,但它并没有真的反应样本点的曲线走势。
它为了拟合所有给定的样本而变得太过复杂,这就是过拟合(over fitting)
相反,如果只是使用一根直线来拟合样本数据,也没有很好的拟合样本的特征。
但它不是太复杂了,而是太简单了,这就是欠拟合(under fitting)